Human Genome Project
-
-

-

Chromosome 9
- Magenta and green. These regions reflect the unique patterns of light and dark bands seen on human chromosomes that have been stained to allow viewing through a light microscope.
- Red. The centromere, or constricted portion, of each chromosome.
- Yellow. Chromosomal regions that vary in staining intensity and are sometimes called heterochromatin (meaning “different color”).
- Yellow with thin magenta horizontal lines. Denote variable regions, called stalks, that connect a very small chromosome arm (a “satellite”) to the chromosome.
-

Mouse and Human Genetic Similarities
The figure at left demonstrates the genetic similarity (homology) of the superficially dissimilar mouse and human species. The similarity is such that human chromosomes can be cut (schematically at least) into about 150 pieces (only about 100 are large enough to appear here), then reassembled into a reasonable approximation of the mouse genome. The colors and corresponding numbers on the mouse chromosomes indicate the human chromosomes containing the homologous segments.
-

Genome Sequence Trace
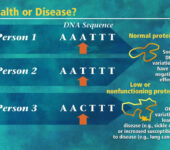
The estimated number of human genes is only one-third as great as previously thought, although the numbers may be revised as more computational and experimental analyses are performed. Scientists suggest that the genetic key to human complexity lies not in gene number but in how gene parts are used to build different products in a process called alternative splicing. Other underlying reasons for greater complexity are the thousands of chemical modifications made to proteins and the repertoire of regulatory mechanisms controlling these processes.
-

-
Chromosome 7
- Magenta and green. These regions reflect the unique patterns of light and dark bands seen on human chromosomes that have been stained to allow viewing through a light microscope.
- Red. The centromere, or constricted portion, of each chromosome.
- Yellow. Chromosomal regions that vary in staining intensity and are sometimes called heterochromatin (meaning “different color”).
- Yellow with thin magenta horizontal lines. Denote variable regions, called stalks, that connect a very small chromosome arm (a “satellite”) to the chromosome.
-
Chromosome 6
- Magenta and green. These regions reflect the unique patterns of light and dark bands seen on human chromosomes that have been stained to allow viewing through a light microscope.
- Red. The centromere, or constricted portion, of each chromosome.
- Yellow. Chromosomal regions that vary in staining intensity and are sometimes called heterochromatin (meaning “different color”).
- Yellow with thin magenta horizontal lines. Denote variable regions, called stalks, that connect a very small chromosome arm (a “satellite”) to the chromosome.
-

Chromosome 5
- Magenta and green. These regions reflect the unique patterns of light and dark bands seen on human chromosomes that have been stained to allow viewing through a light microscope.
- Red. The centromere, or constricted portion, of each chromosome.
- Yellow. Chromosomal regions that vary in staining intensity and are sometimes called heterochromatin (meaning “different color”).
- Yellow with thin magenta horizontal lines. Denote variable regions, called stalks, that connect a very small chromosome arm (a “satellite”) to the chromosome.
-
Chromosome 4
- Magenta and green. These regions reflect the unique patterns of light and dark bands seen on human chromosomes that have been stained to allow viewing through a light microscope.
- Red. The centromere, or constricted portion, of each chromosome.
- Yellow. Chromosomal regions that vary in staining intensity and are sometimes called heterochromatin (meaning “different color”).
- Yellow with thin magenta horizontal lines. Denote variable regions, called stalks, that connect a very small chromosome arm (a “satellite”) to the chromosome.